Fig. 1
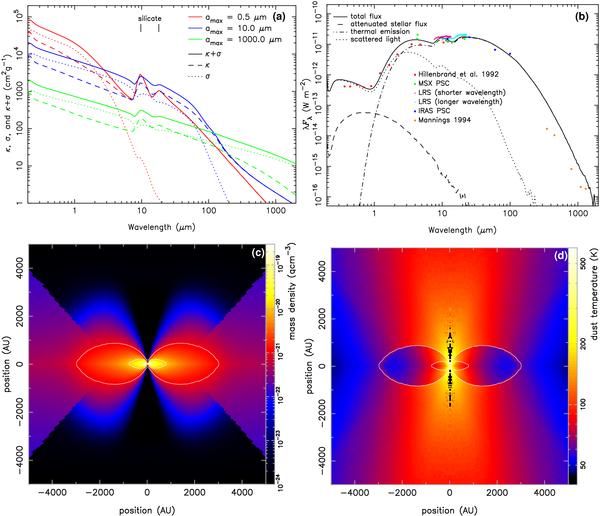
Results of the selected model. a) The dust opacities as functions of the wavelength. The red, blue, and green curves denote the dust models with amax values of 0.5 μm, 10.0 μm, and 1000.0 μm, respectively. The dotted, dashed, and solid lines denote the scattering opacity σ, the absorptive opacity κ, and the total opacity κ + σ, respectively. b) Comparisons of the model SEDs with the previous observations. The solid, dashed, dashed-dotted, and dotted curves denote the total flux, the attenuated stellar flux, the thermal emission, and the scattered flux. The red, green, orange, light blue, violet, and yellow dots are data from Hillenbrand et al. (1992), the MSX point source catalog (PSC), the IRAS LRS spectra of short and long wavelengths, IRAS PSC, and Mannings (1994). c, d) The mass density and dust temperature distribution maps in the inner 5000 × 5000 AU region. The two contour lines indicate the threshold densities of 1 × 10-20 g cm-3 and 1 × 10-21 g cm-3 to change the grain sizes. From the inner, higher density region, the grain models with amax = 1000.0 μm, 10.0 μm, and 0.5 μm are applied.
Current usage metrics show cumulative count of Article Views (full-text article views including HTML views, PDF and ePub downloads, according to the available data) and Abstracts Views on Vision4Press platform.
Data correspond to usage on the plateform after 2015. The current usage metrics is available 48-96 hours after online publication and is updated daily on week days.
Initial download of the metrics may take a while.