Fig. 3
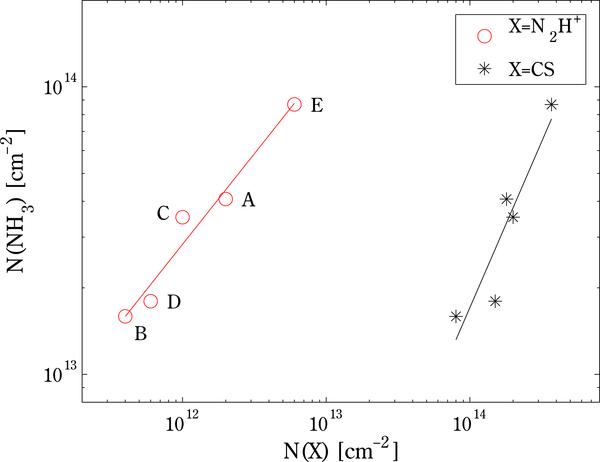
Column density relation between our observed o-NH3 and N2H+ and CS respectively. The column densities are calculated from optical depths integrated over five velocity bins associated with absorption features as indicated by capital letters in the plot. N2H+ and CS data as well as ranges of velocity bins are adopted from Greaves & Nyman (1996). The solid lines show the logarithmic least-square fits to each of the data sets, and their slopes are 1.15 ± 0.27 and 0.63 ± 0.07 for CS and N2H+, respectively.
Current usage metrics show cumulative count of Article Views (full-text article views including HTML views, PDF and ePub downloads, according to the available data) and Abstracts Views on Vision4Press platform.
Data correspond to usage on the plateform after 2015. The current usage metrics is available 48-96 hours after online publication and is updated daily on week days.
Initial download of the metrics may take a while.