Fig. 4
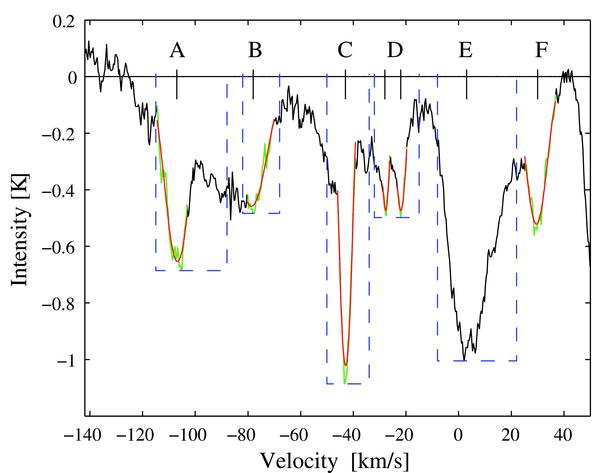
Gaussian optical depth fits to the observed ground-state NH3 absorptions, corresponding to components in formaldehyde. The spectrum in black is the continuum-subtracted (TC = 1.29 K) observed spectrum. The velocity ranges over which the fits are made are highlighted in green and the fits themselves are shown in red. The blue dashed boxes mark the velocity ranges over which the absorption is integrated for the column density comparisons in Fig. 3.
Current usage metrics show cumulative count of Article Views (full-text article views including HTML views, PDF and ePub downloads, according to the available data) and Abstracts Views on Vision4Press platform.
Data correspond to usage on the plateform after 2015. The current usage metrics is available 48-96 hours after online publication and is updated daily on week days.
Initial download of the metrics may take a while.