Fig. 2
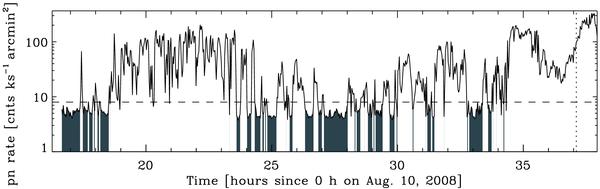
Flaring-background light curve in the pn detector during our XMM-Newtonobservation of EX Lup. The line is the background light curve produced by the SAS task epchain. The horizontal dashed line indicates the maximum level of flaring-background for our spectral analysis. The resulting time periods with low flaring-background are shown in grey. The vertical dotted line indicates the end of the useful exposure.
Current usage metrics show cumulative count of Article Views (full-text article views including HTML views, PDF and ePub downloads, according to the available data) and Abstracts Views on Vision4Press platform.
Data correspond to usage on the plateform after 2015. The current usage metrics is available 48-96 hours after online publication and is updated daily on week days.
Initial download of the metrics may take a while.