Fig. 1
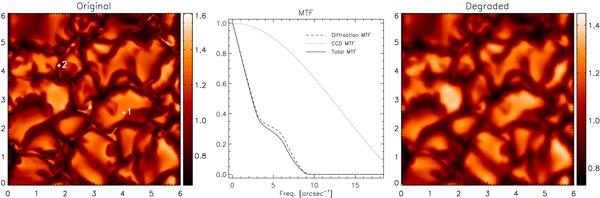
Continuum intensity map at the original resolution of the MHD models (left) and degraded considering telescope diffraction and detector pixel size (right). The central panel shows the MTF of the CCD (dotted line), that of the diffraction-limited telescope including the central obscuration (dashed line), and the total MTF (solid line).
Current usage metrics show cumulative count of Article Views (full-text article views including HTML views, PDF and ePub downloads, according to the available data) and Abstracts Views on Vision4Press platform.
Data correspond to usage on the plateform after 2015. The current usage metrics is available 48-96 hours after online publication and is updated daily on week days.
Initial download of the metrics may take a while.