Fig. 6
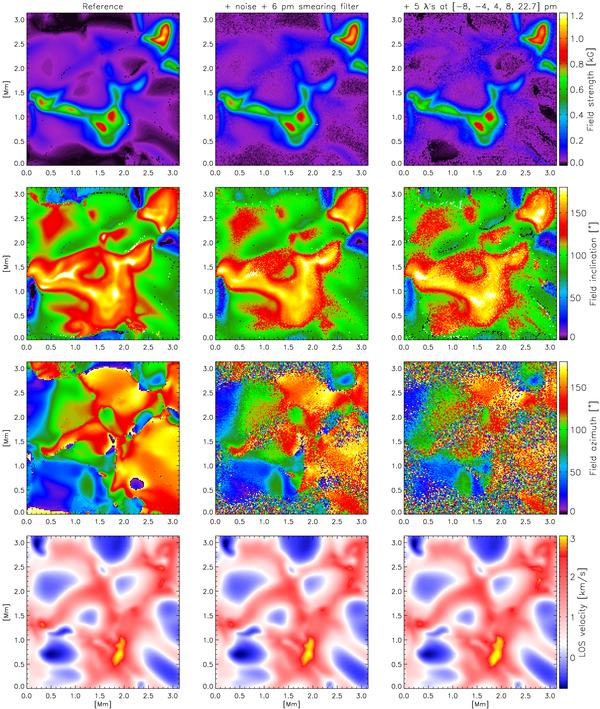
ME inversions of the Fe i 525.02 nm line synthesized with the help of MHD models. From top to bottom: magnetic field strength, inclination and azimuth, and LOS velocity. The left panels represent the results from the data degraded by telescope diffraction and CCD pixelation. The middle panels show the maps retrieved from the degraded profiles after convolution with a 6 pm wide filter and addition of noise. The right panels display the results obtained from the spatially and spectrally degraded observations with noise, sampled at five wavelengths points. Except for the reference, SNR = 1000 in all maps.
Current usage metrics show cumulative count of Article Views (full-text article views including HTML views, PDF and ePub downloads, according to the available data) and Abstracts Views on Vision4Press platform.
Data correspond to usage on the plateform after 2015. The current usage metrics is available 48-96 hours after online publication and is updated daily on week days.
Initial download of the metrics may take a while.