Fig. 7
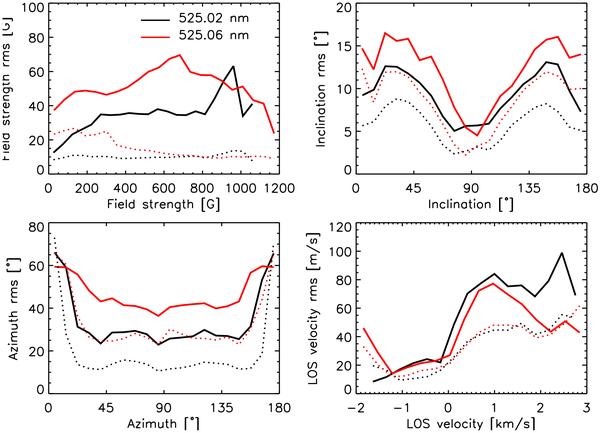
Rms differences between the inferred ME parameters and the reference. The black and red lines stand for Fe i 525.02 nm and 525.06 nm, respectively. The dotted lines correspond to the inversion of the degraded profiles but with full spectral sampling. The solid lines show the results for the degraded data sampled at the five wavelengths of the IMaX vector spectropolarimetric mode.
Current usage metrics show cumulative count of Article Views (full-text article views including HTML views, PDF and ePub downloads, according to the available data) and Abstracts Views on Vision4Press platform.
Data correspond to usage on the plateform after 2015. The current usage metrics is available 48-96 hours after online publication and is updated daily on week days.
Initial download of the metrics may take a while.