Free Access
Fig. 2
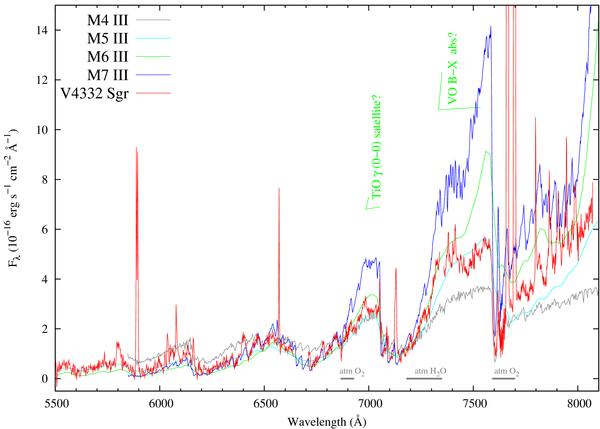
The 2009 spectrum of V4332 Sgr (red – the same as in Fig. 1) compared to spectra of M-type giants taken from Bagnulo et al. (2003)5 and Gunn & Stryker (1983). The regions suspected of being affected by some “extra” molecular absorption are indicated by vertical green marks.
Current usage metrics show cumulative count of Article Views (full-text article views including HTML views, PDF and ePub downloads, according to the available data) and Abstracts Views on Vision4Press platform.
Data correspond to usage on the plateform after 2015. The current usage metrics is available 48-96 hours after online publication and is updated daily on week days.
Initial download of the metrics may take a while.