Fig. 3
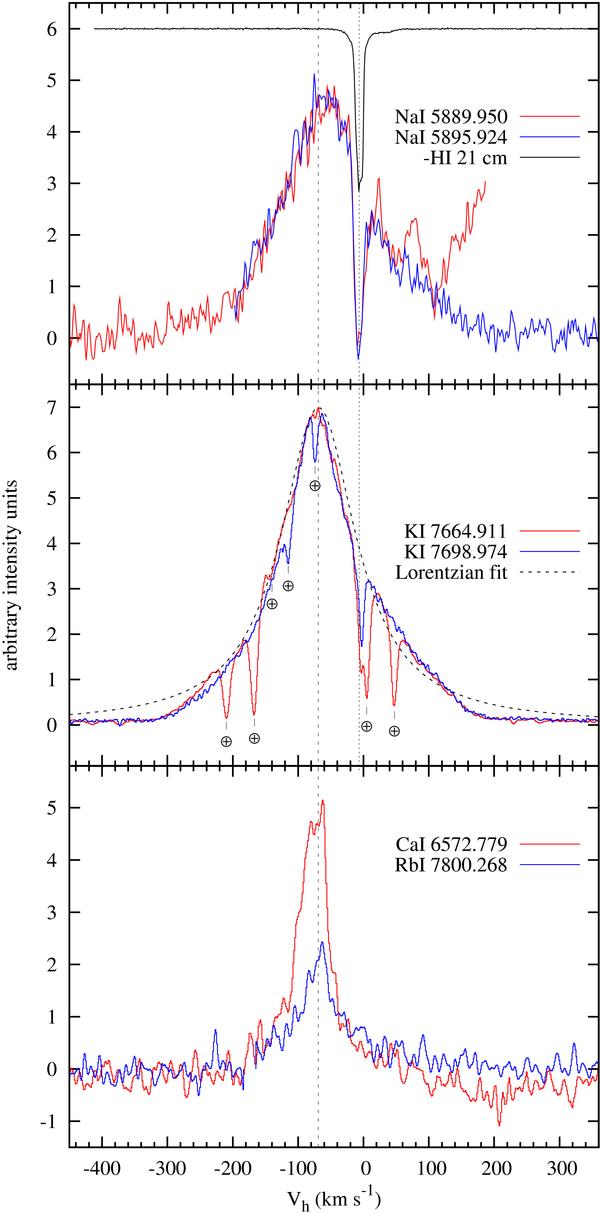
Profiles of the strong resonance lines in the spectrum of V4332 Sgr. Spectra are rescaled. The vertical lines mark the centre of the K i lines at –69 km s-1 and the centre of interstellar absorption features of Na i at –7.2 km s-1. Top: the Na i profiles, clipped for clarity. The top spectrum shows the intensity-inverted profile of the H i 21 cm line (see text). Middle: the observed K i lines and a theoretical Lorentzian profile. The strongest telluric absorption lines are indicated. Bottom: Ca i and Rb i lines, spectra slightly smoothed to reduce the noise.
Current usage metrics show cumulative count of Article Views (full-text article views including HTML views, PDF and ePub downloads, according to the available data) and Abstracts Views on Vision4Press platform.
Data correspond to usage on the plateform after 2015. The current usage metrics is available 48-96 hours after online publication and is updated daily on week days.
Initial download of the metrics may take a while.