Fig. 1
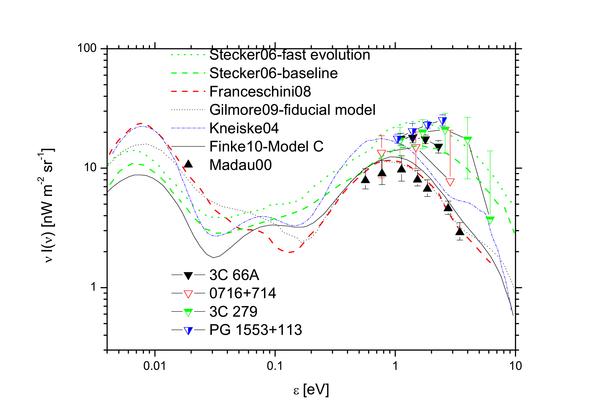
Upper limits of the EBL given by 3C 66A, 0716+714, 3C 279 and PG 1553+113 under the assumption that the Fermi spectral index measured by Fermi-LAT can be used as an lower limit of the intrinsic VHE spectral index. Also plotted are several EBL models: the baseline and fast evolution models of Stecker et al. (2006) (dash, dot green curves, respectively), the model of Franceschini et al. (2008) (dash red curve), the fiducial model from Gilmore et al. (2009) (dot black curve), the best fit model from Kneiske et al. (2004) (dot-dash blue curve), and the Model C of Finke et al. (2010) (solid black curve). We also list the lower limits of EBL from source counts with upward triangles Madau & Pozzetti 2000).
Current usage metrics show cumulative count of Article Views (full-text article views including HTML views, PDF and ePub downloads, according to the available data) and Abstracts Views on Vision4Press platform.
Data correspond to usage on the plateform after 2015. The current usage metrics is available 48-96 hours after online publication and is updated daily on week days.
Initial download of the metrics may take a while.