Fig. 1
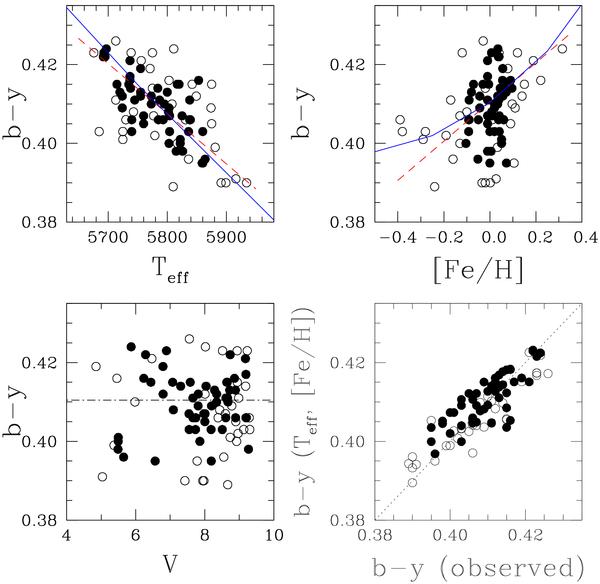
(b–y) vs. Teff (upper left panel), [Fe/H] (upper right panel), and V magnitude (lower left panel, with a dot-dashed line at (b − y)⊙). The results of the global fit vs. the observed (b − y) color is presented in the lower right panel, with the dotted line indicating equality. Solar twins and solar analogs are represented by filled and open circles, respectively. The dependences of the fit on Teff and [Fe/H] are shown by dashed lines, while the relative predictions of MARCS models (normalized to our inferred solar colors) are shown by solid lines.
Current usage metrics show cumulative count of Article Views (full-text article views including HTML views, PDF and ePub downloads, according to the available data) and Abstracts Views on Vision4Press platform.
Data correspond to usage on the plateform after 2015. The current usage metrics is available 48-96 hours after online publication and is updated daily on week days.
Initial download of the metrics may take a while.