Fig. 2
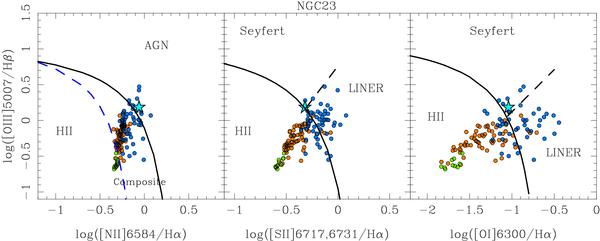
a) Observed diagnostic diagrams for the spatially resolved measurements of NGC 23. The line ratios are not corrected for extinction or underlying stellar absorption. The star symbols are the nuclear region measurements given in Paper I. The line ratios for individual spaxels are color coded according to the value of the EW(Hα)em of the line in emission: green dots EW(Hα)em > 60 Å, orange dots 20 Å < EW(Hα)em ≤ 60 Å, blue dots 5 Å < EW(Hα)em ≤ 20 Å, and red dots EW(Hα)em ≤ 5 Å. The solid lines are the “maximum starburst lines” defined by Kewley et al. (2001) from theoretical modeling, and the thick dashed lines are the empirical separation between AGN and H ii regions of Kauffmann et al. (2003), and between Seyfert and LINERs of Kewley et al. (2006).
Current usage metrics show cumulative count of Article Views (full-text article views including HTML views, PDF and ePub downloads, according to the available data) and Abstracts Views on Vision4Press platform.
Data correspond to usage on the plateform after 2015. The current usage metrics is available 48-96 hours after online publication and is updated daily on week days.
Initial download of the metrics may take a while.