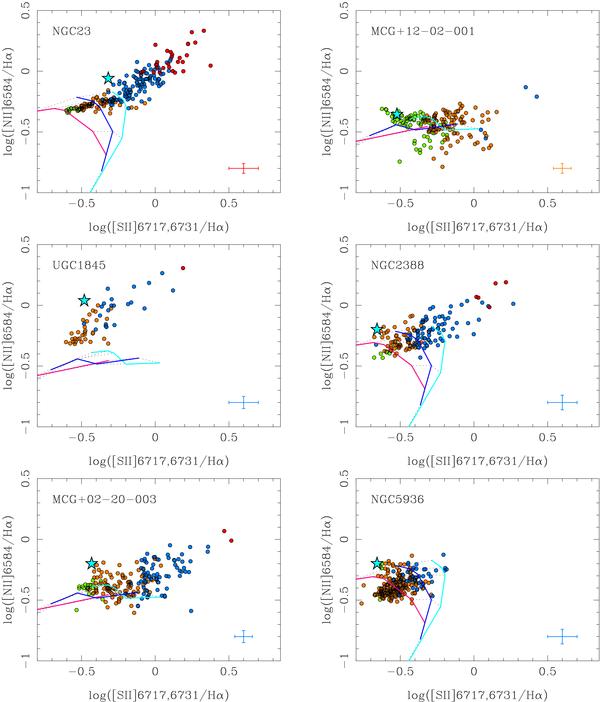
Fig. 3

Spatially resolved observed [N ii]λ6584/Hα vs. [S ii]λλ6717, 6731/Hα diagrams for each of the galaxies in our sample. The individual spaxel measurements are color coded according to EW(Hα)em as in Fig. 2. The spaxels corresponding to the nuclear region are shown as a star-like symbol. The line ratios are not corrected for underlying stellar absorption or extinction. The error bars are the typical uncertainties in the measured line ratios for the smallest range of EW(Hα)em, color-coded as the data points, measured for each galaxy. The uncertainties in the line ratios of spaxels with EW(Hα)em greater than the plotted range are always lower. The solid lines are the Dopita et al. (2006) models for evolving H ii regions for instantaneous star formation and 2 Z⊙ metallicity in all cases except for the MCG +12-02-001, UGC 1845 and MCG +02-20-003 plots where we show the Z⊙ models (see Table 7 for the estimated abundances). The pink, dark blue and light blue lines correspond to log ℛ parameters of −2, −4, and −6. The dashed lines are isochrones for ages 0.1, 0.5, 1, 2 and 3 Myr from top to bottom. The ℛ parameter is defined as the ratio of the mass of the ionizing cluster to the pressure of the interstellar medium.
Current usage metrics show cumulative count of Article Views (full-text article views including HTML views, PDF and ePub downloads, according to the available data) and Abstracts Views on Vision4Press platform.
Data correspond to usage on the plateform after 2015. The current usage metrics is available 48-96 hours after online publication and is updated daily on week days.
Initial download of the metrics may take a while.


