Fig. 4
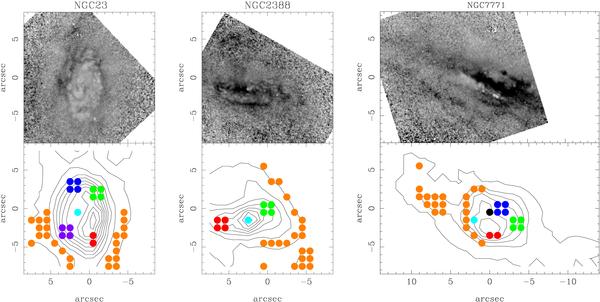
Upper panels: HST/NICMOS 1.6 μm to 1.1μm flux ratio maps. Dark regions show a deficit of 1.1 μm flux, that is, a redder F160W−F110W color. All three galaxies are shown on the same flux ratio scale. Lower panels: the contours are the observed Hα fluxes of the three galaxies for which extracted spectra of circumnuclear H ii regions. For each galaxy we show the regions of interest: the nucleus (defined as the peak of the 6200 Å continuum emission, light blue dots), bright H ii regions (red, blue, purple, and green dots). The orange dots are the spaxels used to produce the average spectrum of regions with relatively low EW of Hα (see Sect. 2.3). For NGC 7771 we additionally extracted a spectrum of the possible location of the true nucleus (shown as a black dot), based on the Hα velocity field (see Paper I for details).
Current usage metrics show cumulative count of Article Views (full-text article views including HTML views, PDF and ePub downloads, according to the available data) and Abstracts Views on Vision4Press platform.
Data correspond to usage on the plateform after 2015. The current usage metrics is available 48-96 hours after online publication and is updated daily on week days.
Initial download of the metrics may take a while.