Fig. 5
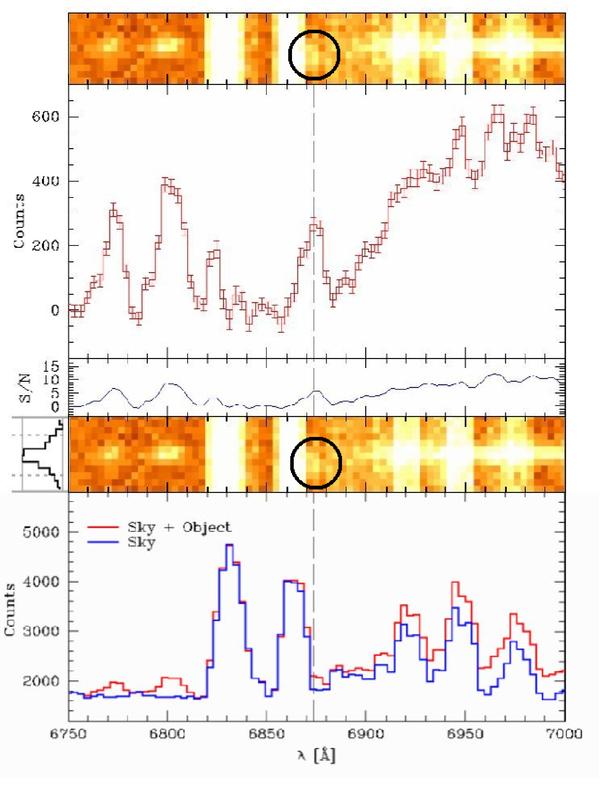
Detailed analysis of the Ly-α emission line detection. The top panel shows the blow up of the region centered on the Ly-α emission at 6873.45 Å (dashed line), corresponding to 1215.67 Å in the emitter rest frame. The central panel shows the corresponding signal-to-noise ratio. The bottom panel reports the counts from the sky (blue line) and for the sky+object (red line). The position of the Ly-α emission in the 2D spectrum (shown in both panels), is marked by a circle and has an offset with respect to the afterglow continuum (corresponding to 0.3′′; see Sect. 2.2.3 for details).
Current usage metrics show cumulative count of Article Views (full-text article views including HTML views, PDF and ePub downloads, according to the available data) and Abstracts Views on Vision4Press platform.
Data correspond to usage on the plateform after 2015. The current usage metrics is available 48-96 hours after online publication and is updated daily on week days.
Initial download of the metrics may take a while.