Fig. 1
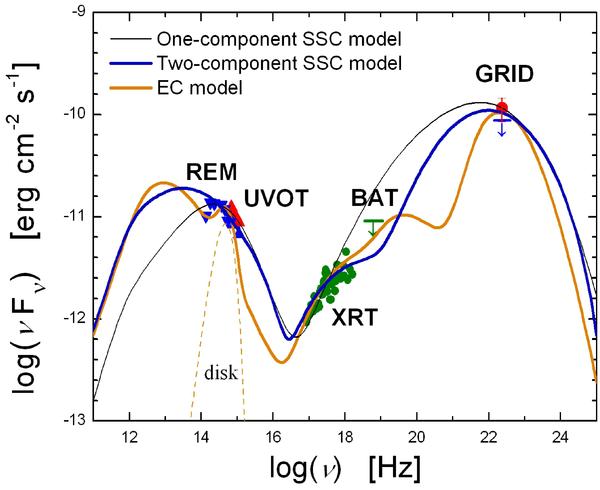
The SED of PKS 0537 − 441, including near-infrared and optical REM data, UV, soft X-ray and hard X-ray Swift data, and γ-ray AGILE data. Blue symbols refer to the period 2008 October 7–13, red symbols refer to the period 2008 October 13–17. The Swift/XRT and Swift/BAT data (in green) are averaged over the whole observing period. For Swift/UVOT are represented the data collected in the u, b, uvw1 filters, with the data of the first period averaged over all the available observations. The black, blue and orange lines represent the one-component SSC, two-component SSC, and EC model, respectively. The dashed orange line represents the emission from the disk in the EC model.
Current usage metrics show cumulative count of Article Views (full-text article views including HTML views, PDF and ePub downloads, according to the available data) and Abstracts Views on Vision4Press platform.
Data correspond to usage on the plateform after 2015. The current usage metrics is available 48-96 hours after online publication and is updated daily on week days.
Initial download of the metrics may take a while.