Fig. 1
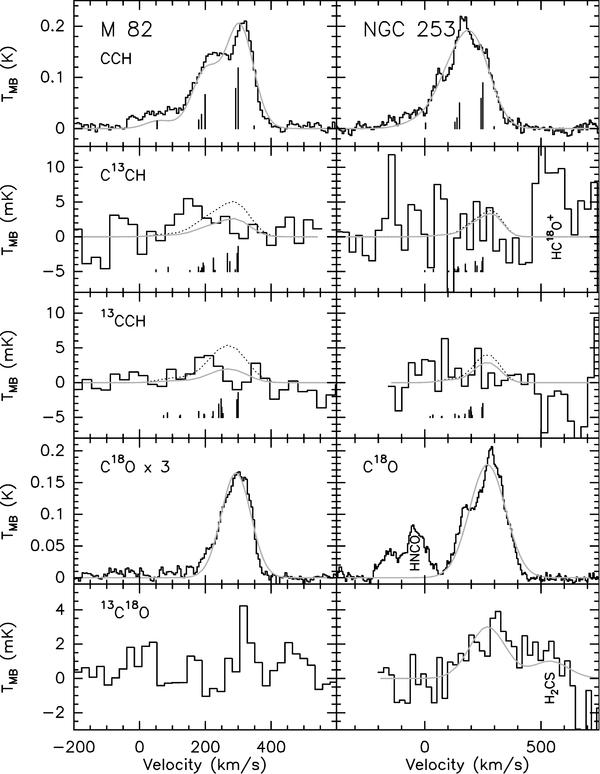
Observed spectra of the J = 2 − 1 transitions of CCH, C13CH, and 13CCH, and the J = 1−0 transitions of C18O and 13C18O toward M 82 and NGC 253. The intensity of the C18O spectrum in M 82 has been multiplied by a factor of 3 for comparison and visualization purposes. The fit to the CCH and C18O profiles are shown with grey lines. For the undetected isotopologues we overlay the expected spectra assuming a 12C/13C isotopic ratio of 40 (dotted lines), as well as the upper limit profile derived in this work (grey lines). Vertical lines represent the relative intensities of the hyperfine components used to fit the detected CCH profiles, and to calculate the upper limit to the intensities for the isotopologues. 13C18O is tentatively detected blended to a H2CS feature toward NGC 253. Spectra are presented at the original 4 and 2 MHz (~7 and 5 kms-1) resolution for CCH and C18O, respectively. C13CH and 13CCH data were smoothed to 16 MHz (~28 kms-1) and 13C18O to 8 MHz (~23 kms-1).
Current usage metrics show cumulative count of Article Views (full-text article views including HTML views, PDF and ePub downloads, according to the available data) and Abstracts Views on Vision4Press platform.
Data correspond to usage on the plateform after 2015. The current usage metrics is available 48-96 hours after online publication and is updated daily on week days.
Initial download of the metrics may take a while.