Press Release
Free Access
Fig. 1
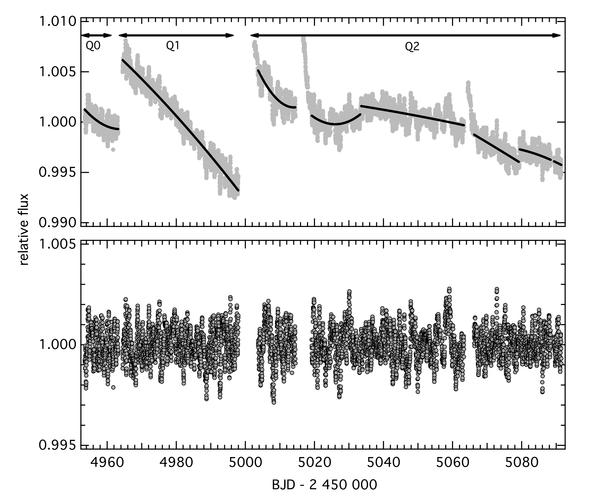
Relative flux for the Q0, Q1, and Q2 data of KIC 6838420. The top panel shows the original time series (grey points) with the 2nd order polynomial fits overlaid (black lines). The bottom panel shows the residual time series.
Current usage metrics show cumulative count of Article Views (full-text article views including HTML views, PDF and ePub downloads, according to the available data) and Abstracts Views on Vision4Press platform.
Data correspond to usage on the plateform after 2015. The current usage metrics is available 48-96 hours after online publication and is updated daily on week days.
Initial download of the metrics may take a while.