Fig. 2
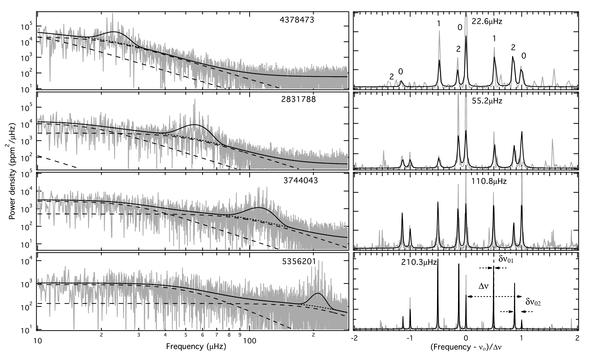
Left panel: power density spectra for a sample of red giants observed with Kepler. Black lines indicate the global model fit and dotted lines show the global model plotted without the Gaussian component, which serve as a model for the background signal. Dashed lines indicate the background components. KIC numbers are given in the upper right corners. Right panel: residual power density spectra shifted to the central frequency (given in absolute numbers in the plots) of our model to determine the frequency separations and normalised to the large frequency separation. Black lines correspond to the best fitting model. The dashed line marks the midpoint between adjacent l = 0 modes.
Current usage metrics show cumulative count of Article Views (full-text article views including HTML views, PDF and ePub downloads, according to the available data) and Abstracts Views on Vision4Press platform.
Data correspond to usage on the plateform after 2015. The current usage metrics is available 48-96 hours after online publication and is updated daily on week days.
Initial download of the metrics may take a while.