Fig. 6
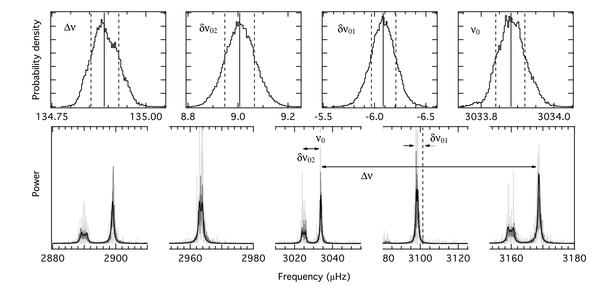
Same as Fig. 5 but as delivered from our algorithm to determine the frequency spacings. Top panels: probability density functions for the three spacing parameters and the central frequency of our model fit. Median values and 1σ limits are indicated by vertical solid and dashed line, respectively. Bottom panel: residual power density spectrum (light-grey) of a 1-year VIRGO time series and the corresponding model fit (black line).
Current usage metrics show cumulative count of Article Views (full-text article views including HTML views, PDF and ePub downloads, according to the available data) and Abstracts Views on Vision4Press platform.
Data correspond to usage on the plateform after 2015. The current usage metrics is available 48-96 hours after online publication and is updated daily on week days.
Initial download of the metrics may take a while.