Fig. 7
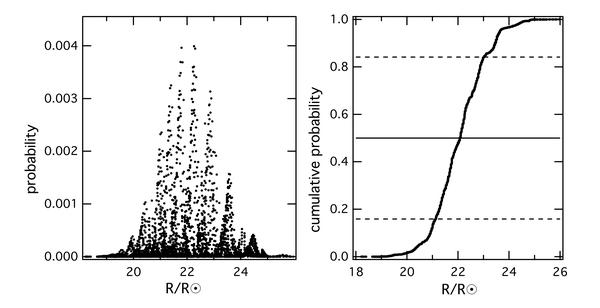
The projected probability (left) and cumulative probability (right) distribution functions for the radius of the artificial test star 6 (Basu et al. 2010). The full horizontal line correspond to the median and the dashed lines give the ± 1σ confidence interval.
Current usage metrics show cumulative count of Article Views (full-text article views including HTML views, PDF and ePub downloads, according to the available data) and Abstracts Views on Vision4Press platform.
Data correspond to usage on the plateform after 2015. The current usage metrics is available 48-96 hours after online publication and is updated daily on week days.
Initial download of the metrics may take a while.