Fig. 9
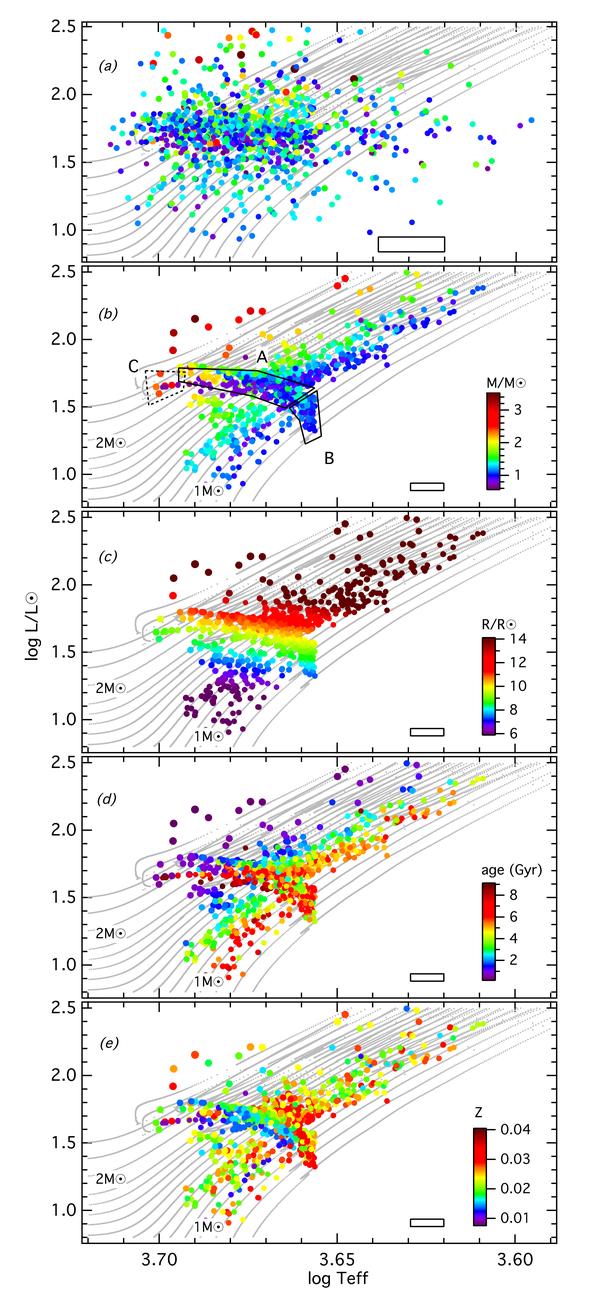
H-R diagram showing the location of our red-giant sample as directly determined from Eqs. (4) and (5) using the KIC effective temperatures (panel a)) and from the comparison with the stellar model grid (panel b) to e)). The colour code (in the online version only) indicates the stellar mass (a) and b)), radius c)), age d)), and metallicity (e)), where the radius scale has been truncated below 6 and above 14 R⊙ . Grey lines show solar-metallicity BaSTI evolutionary tracks. The boxes given in the lower right corners illustrate typical uncertainties.
Current usage metrics show cumulative count of Article Views (full-text article views including HTML views, PDF and ePub downloads, according to the available data) and Abstracts Views on Vision4Press platform.
Data correspond to usage on the plateform after 2015. The current usage metrics is available 48-96 hours after online publication and is updated daily on week days.
Initial download of the metrics may take a while.