Fig. 3
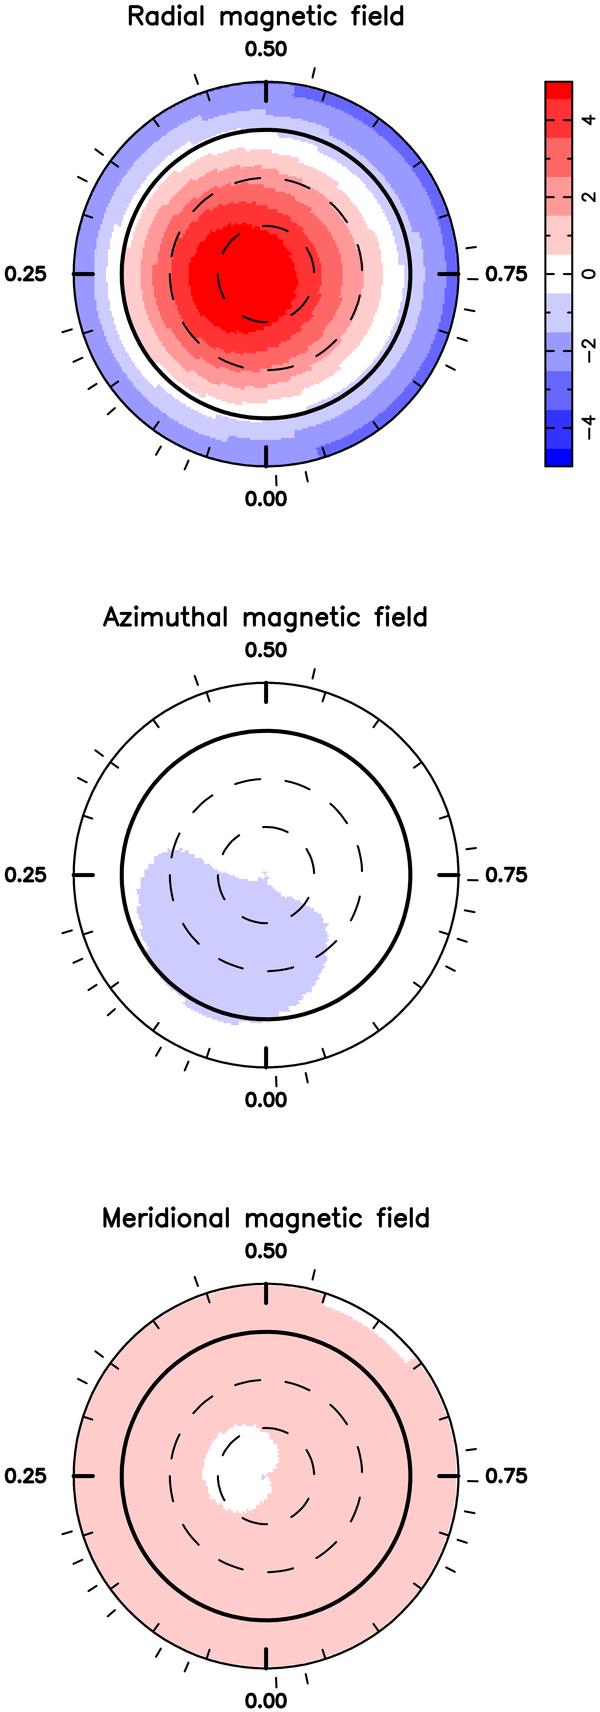
Maximum-entropy reconstruction of the large-scale magnetic topology of HD 46375 as derived by the TBL/NARVAL data set. The radial, azimutal, and meridional components of the field are shown from top to bottom. Magnetic flux values are given in Gauss as indicated along the vertical colour bar. The star is shown in flattened polar projection down to latitudes of −30°, with the equator depicted as a bold circle and parallels as dashed circles. Radial ticks around each plot indicate the rotational phases of observations.
Current usage metrics show cumulative count of Article Views (full-text article views including HTML views, PDF and ePub downloads, according to the available data) and Abstracts Views on Vision4Press platform.
Data correspond to usage on the plateform after 2015. The current usage metrics is available 48-96 hours after online publication and is updated daily on week days.
Initial download of the metrics may take a while.