Free Access
Fig. 7
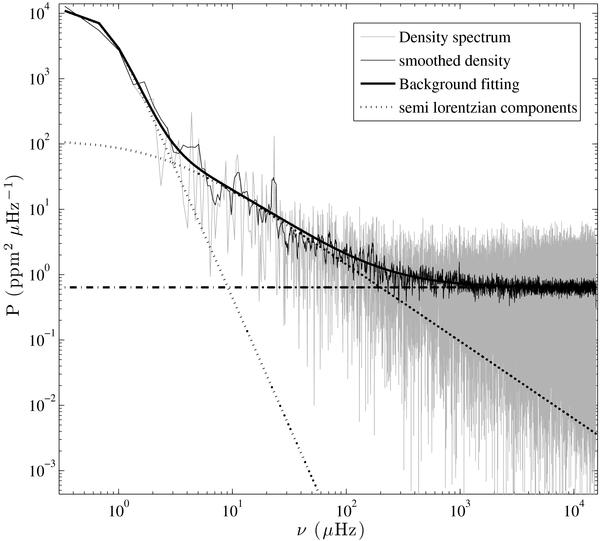
Density spectrum, in log-scale axis. The black curve corresponds to the averaged spectrum obtained with a box-car with a moving weighted average, of variable width. There is no clear excess power at high frequency that could be directly related to pressure modes.
Current usage metrics show cumulative count of Article Views (full-text article views including HTML views, PDF and ePub downloads, according to the available data) and Abstracts Views on Vision4Press platform.
Data correspond to usage on the plateform after 2015. The current usage metrics is available 48-96 hours after online publication and is updated daily on week days.
Initial download of the metrics may take a while.