Fig. 9
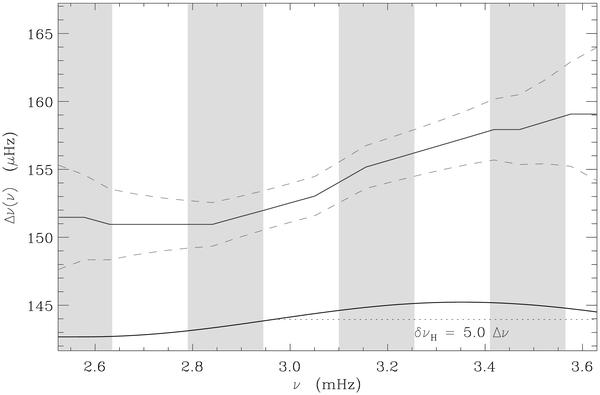
Variation in the large separation with frequency, derived from the autocorrelation of the time series. The power spectrum was first windowed with a 0.75 mHz-half width cosine filter, as indicated in the lower-right corner. The sampling of the curve corresponds crudely to the mean large separation. The size of the dots is representative of the amplitude of the correlated signal. One-σ error bars (dashed lines) are derived from Mosser & Appourchaux (2009).
Current usage metrics show cumulative count of Article Views (full-text article views including HTML views, PDF and ePub downloads, according to the available data) and Abstracts Views on Vision4Press platform.
Data correspond to usage on the plateform after 2015. The current usage metrics is available 48-96 hours after online publication and is updated daily on week days.
Initial download of the metrics may take a while.