Fig. 1
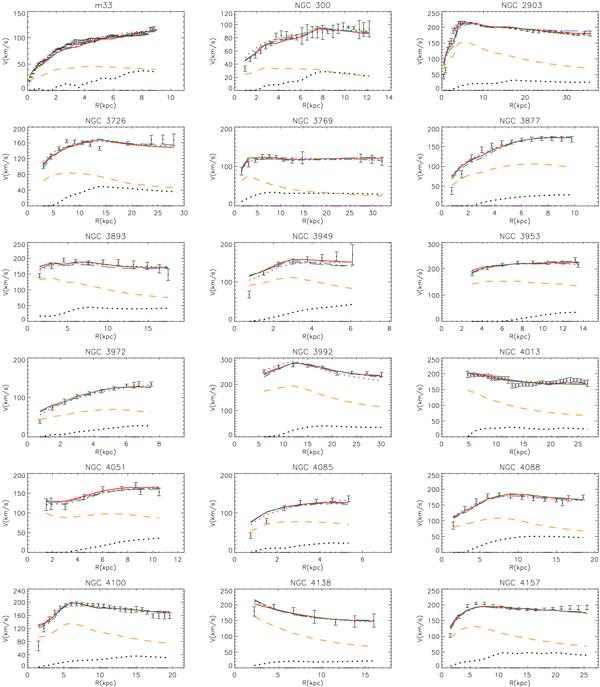
Rotation curves of 32 mainly HSB galaxies. The points with vertical error bars are the observed data. The dotted (black) and short dashed lines are contributions of the gaseous and stellar components to the Newtonian rotation speeds, respectively. The long dashed (blue) line is that of MOND1. The solid line is the rotation curve constructed through MOND3. The M∗/Ls of MOND3 are used in plotting the stellar component. The dashed-dotted (green) and dotted (red) lines are those of the MOG and NFW models, respectively.
Current usage metrics show cumulative count of Article Views (full-text article views including HTML views, PDF and ePub downloads, according to the available data) and Abstracts Views on Vision4Press platform.
Data correspond to usage on the plateform after 2015. The current usage metrics is available 48-96 hours after online publication and is updated daily on week days.
Initial download of the metrics may take a while.