Fig. 3
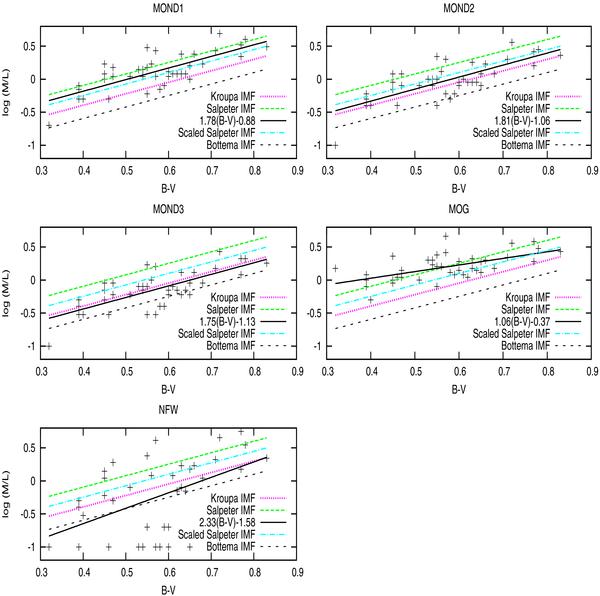
Plots of M∗/L versus B − V. The solid line in each panel is the best fit to the prediction of the model in question. The slopes and y-intercepts of best-fitted lines are shown in the panels. Slopes of MOND1, MOND2, and MOND3 are reasonably close to the prediction of SPS, 1.74. That of MOG is not. Data points in NFW panel are much dispersed to conclude a meaningful correlation. In MOND1, MOND2, and MOND3 errors in the slopes, ±(0.23,0.21,0.26), respectively, are small enough to distinguish one model from the other. The errors in the y-intercepts, ±(0.12,0.14,0.15), respectively, are small enough to distinguish one IMF from the other. The other lines are the theoretical predictions of SPS with different IMFs (Bell & de Jong 2001, Bell et al. 2003). They are included here for comparison. They have almost the same slope, but different y-intercepts.
Current usage metrics show cumulative count of Article Views (full-text article views including HTML views, PDF and ePub downloads, according to the available data) and Abstracts Views on Vision4Press platform.
Data correspond to usage on the plateform after 2015. The current usage metrics is available 48-96 hours after online publication and is updated daily on week days.
Initial download of the metrics may take a while.