Fig. 1
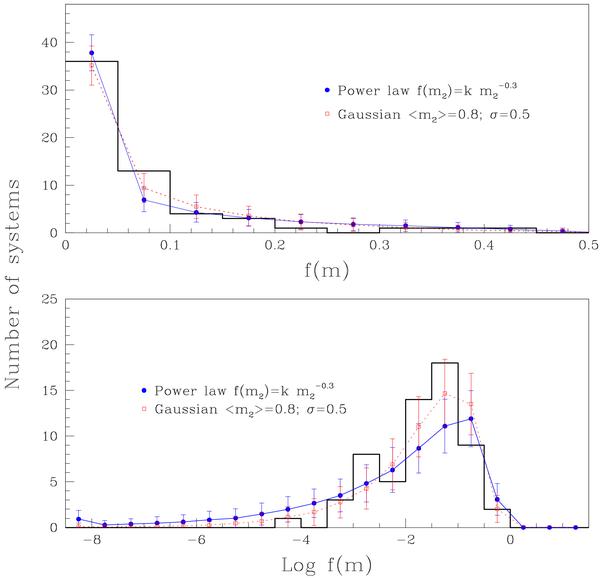
Comparisons between model and observed distributions for the sample of 60 SB from CP07. The upper panel shows the distribution of the mass function, f(m), as well as the two best fits obtained by CP07: the solid line connecting the heavy dots with error bars corresponds to a power law, with index α = −0.3, while the dotted line connecting circles is a Gaussian, centred around 0.8 M⊙ and with σM = 0.5 M⊙. The corresponding distributions of log f(m) are shown in the lower panel.
Current usage metrics show cumulative count of Article Views (full-text article views including HTML views, PDF and ePub downloads, according to the available data) and Abstracts Views on Vision4Press platform.
Data correspond to usage on the plateform after 2015. The current usage metrics is available 48-96 hours after online publication and is updated daily on week days.
Initial download of the metrics may take a while.