Fig. 2
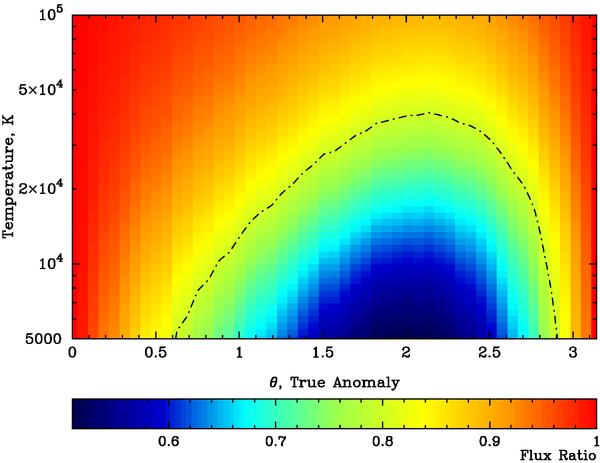
Ratio of VHE fluxes (integrated between 380 GeV−10 TeV) for any two different points on the orbit characterised by the same distance to the optical star as a function of star temperature and orbital phase. The distribution of scattering electrons was assumed to have a power-law index equal to 2. The dashed-dotted line corresponds to the contour line for a flux ratio of 0.8. Given the relatively large statistical and systematic uncertainties (close to 20%) of the VHE data, in case of a star temperature close to (or higher than) ~4 × 10⁴ K, the TeV light curve might look symmetric with respect to the periastron passage. However, if the star temperature is lower (e.g. ~2 × 10⁴ K), the difference in the fluxes for orbital locations with a true anomaly of θ = ±115° (or θ = ±2 rad) should be measurable with HESS.
Current usage metrics show cumulative count of Article Views (full-text article views including HTML views, PDF and ePub downloads, according to the available data) and Abstracts Views on Vision4Press platform.
Data correspond to usage on the plateform after 2015. The current usage metrics is available 48-96 hours after online publication and is updated daily on week days.
Initial download of the metrics may take a while.