Fig. 3
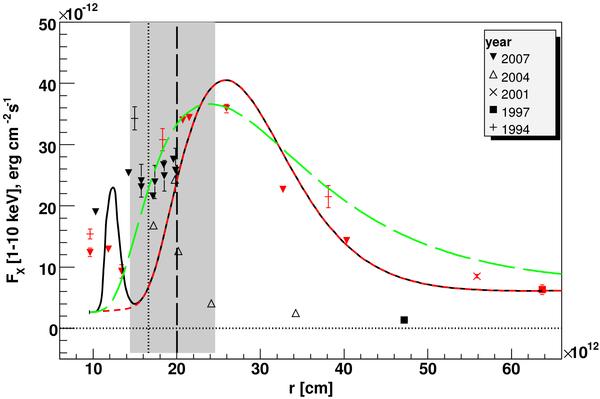
X-ray fluxes in the 1−10 keV band from pre-periastron (black symbols) and post-periastron (red symbols) phases measured in the years 1994, 1997, 2001, 2004, and 2007 as a function of the binary separation distance r. Also shown are three different model X-ray light curves corresponding to the adopted cooling profiles shown in Fig. 4. The grey band indicates the extension of the stellar disc. The vertical dashed and dotted lines correspond to the location of the stellar equatorial plane along the pre- and post-periastron orbit, respectively (Bogomazov 2005).
Current usage metrics show cumulative count of Article Views (full-text article views including HTML views, PDF and ePub downloads, according to the available data) and Abstracts Views on Vision4Press platform.
Data correspond to usage on the plateform after 2015. The current usage metrics is available 48-96 hours after online publication and is updated daily on week days.
Initial download of the metrics may take a while.