Fig. 2
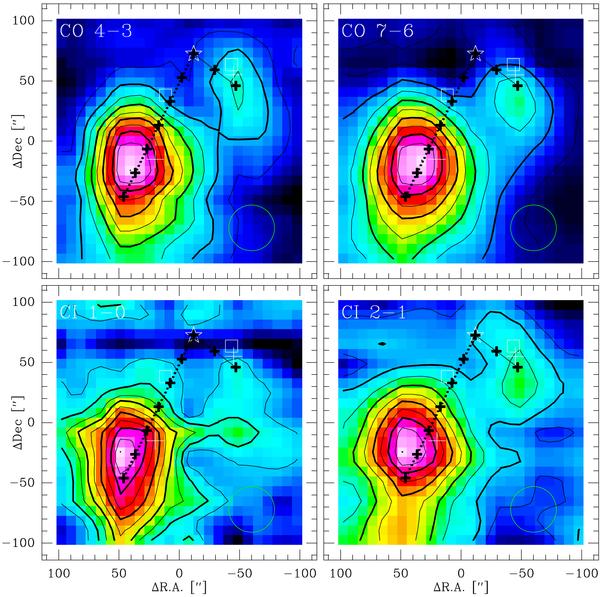
Velocity integrated maps (200″ × 200″) of CO 4–3, 7–6, [C i] 1–0, and 2–1 smoothed to a common angular resolution of 38″ (1.3–1.5 pc at 7–8 kpc), and integrated over a velocity range from 4 to 26 km s-1. Color scale and contours show the same data. Contours range between 10 and 90% of the peak intensities which are 267 K km s-1 for CO 4–3, 121 K km s-1 for CO 7–6, 28 K km s-1 for [C i] 1–0, and 30 K km s-1 for [C i] 2–1. The position of the compact OB cluster is marked by a white star. The position of the the pillars, as seen in the HST images, are marked by white squares. Dashed lines and small crosses spaced by 22″ mark two cut from the OB cluster to the peak positions of the two clumps MM1 (short cut) and MM2 (long cut). The circle marks the resolution and the two white crosses mark the position of the CS(2–1) peaks (Nürnberger et al. 2002) in MM1 and MM2. The position (0, 0) corresponds to RA(J2000.0) =  , Dec(J2000.0) =
  .
.
Current usage metrics show cumulative count of Article Views (full-text article views including HTML views, PDF and ePub downloads, according to the available data) and Abstracts Views on Vision4Press platform.
Data correspond to usage on the plateform after 2015. The current usage metrics is available 48-96 hours after online publication and is updated daily on week days.
Initial download of the metrics may take a while.