Fig. 4
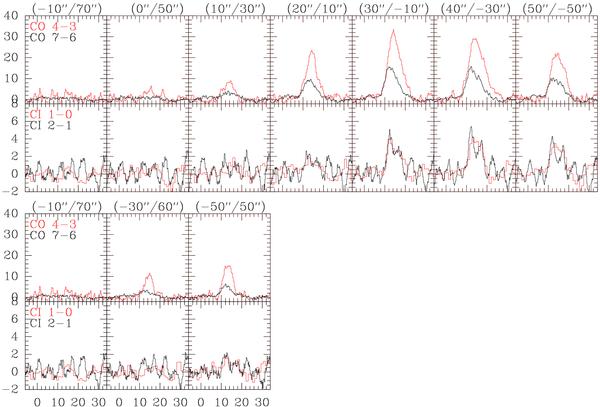
Spectra along two cuts connecting the OB cluster and the centre of MM1 (bottom) and MM2 (top). The CI spectra appear to show sinusoidal standing waves, however a detailed analysis shows no consistent standing wave pattern. These baseline variations are thus attributed to instabilities of the system and/or the atmosphere during the measurements. All data are at a common resolution of 38″ and on the main beam temperature scale.
Current usage metrics show cumulative count of Article Views (full-text article views including HTML views, PDF and ePub downloads, according to the available data) and Abstracts Views on Vision4Press platform.
Data correspond to usage on the plateform after 2015. The current usage metrics is available 48-96 hours after online publication and is updated daily on week days.
Initial download of the metrics may take a while.