Fig. 5
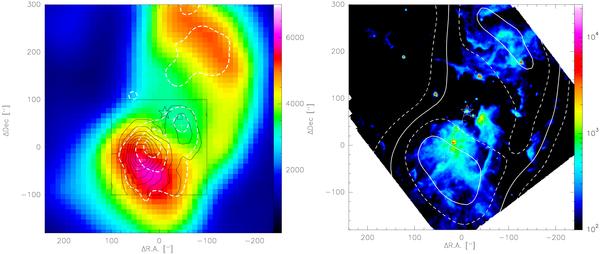
Left: values of the FUV field in units of the Draine field derived from the HIRES 60, and 100 μm fluxes as color map. White, dashed contours mark the Spitzer/IRAC 5.8 μm flux smoothed to a resolution of 35′′. The contour values are 25, 50, and 75% of the peak value. Overlayed in thin contours is the NANTEN2 CO 4–3 map. The central OB cluster is marked by a star. The two pillar heads are denoted by the squares, White crosses mark the positions along the cuts into MM1 and MM2. Right: spitzer/IRAC 5.8 μm observation (in MJy/sr) overlayed with FUV fluxes as derived from IRAS/HIRES flux ratios. The contours correspond to values of χ = 2000, 3000, 4000, and 5000. IRAC pixel size is 1.2′′. The position (0,0) in both panels corresponds to RA(J2000.0) =  , Dec(J2000.0) =
  .
.
Current usage metrics show cumulative count of Article Views (full-text article views including HTML views, PDF and ePub downloads, according to the available data) and Abstracts Views on Vision4Press platform.
Data correspond to usage on the plateform after 2015. The current usage metrics is available 48-96 hours after online publication and is updated daily on week days.
Initial download of the metrics may take a while.