Fig. 2
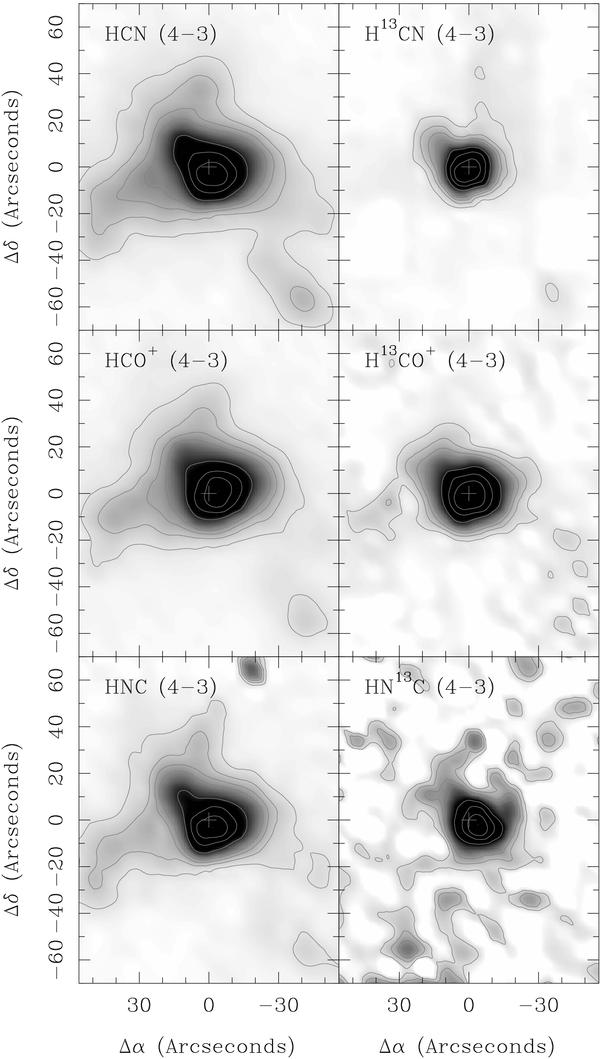
Maps of the integrated intensity ( ) across W49: HCN 4−3 (top-left); H13CN 4−3 (top-right); HCO+ 4−3 (middle-left); H13CO+ 4−3 (middle-right); HNC 4−3 (bottom-left); and HN13C 4−3 (bottom-right) line intensities. The main lines are summed over 150 km s-1, while the 13C-substituted lines are summed over 60 km s-1. The contours show 5, 10, 15, 20, 40 ... 80% of the peak integrated intensity, which is 161 K km s-1 for HCN, 72 K km s-1 for H13CN, 319 K km s-1 for HCO+, 34 K km s-1 for H13CO+, 52 K km s-1 for HNC, and 4 K km s-1 for HN13C.
Current usage metrics show cumulative count of Article Views (full-text article views including HTML views, PDF and ePub downloads, according to the available data) and Abstracts Views on Vision4Press platform.
Data correspond to usage on the plateform after 2015. The current usage metrics is available 48-96 hours after online publication and is updated daily on week days.
Initial download of the metrics may take a while.