Free Access
Fig. 3
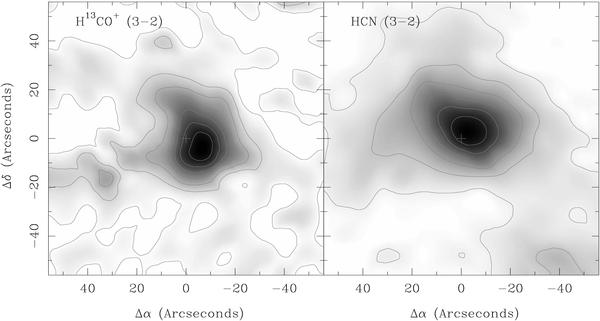
Maps of the integrated intensity ( ) across W49: H13CO+ 3−2 (left) and HCN 3−2 (right). The contours show 0 to 100% of the peak integrated intensity (in steps of 15%), which is 24 K km s-1 for H13CO+ and 172 for HCN.
Current usage metrics show cumulative count of Article Views (full-text article views including HTML views, PDF and ePub downloads, according to the available data) and Abstracts Views on Vision4Press platform.
Data correspond to usage on the plateform after 2015. The current usage metrics is available 48-96 hours after online publication and is updated daily on week days.
Initial download of the metrics may take a while.