Fig. 4
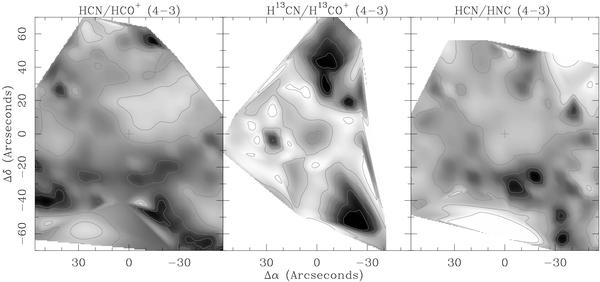
Maps of the HCN/HCO+, H13CN/H13CO+, and HCN/HNC J = 4−3 integrated intensity ( ) ratios across W49A (greyscale and contours). Contours show 10 to 100% of the peak values (in steps of 15%) which are 1.4 for HCN/HCO+, 4.9 for H13CN/H13CO+, and 10.3 for HCN/HNC. A cutoff integrated intensity was applied to each transition before calculating the ratio to avoid divide-by-zero errors in low signal regions of the maps. The cutoff values are 1.5 K km s-1 for HCN, 0.5 K km s-1 for HNC, 3.0 K km s-1 for HCO+, 0.7 K km s-1 for H13CN, and 0.3 K km s-1 for H13CO+.
Current usage metrics show cumulative count of Article Views (full-text article views including HTML views, PDF and ePub downloads, according to the available data) and Abstracts Views on Vision4Press platform.
Data correspond to usage on the plateform after 2015. The current usage metrics is available 48-96 hours after online publication and is updated daily on week days.
Initial download of the metrics may take a while.