Fig. 5
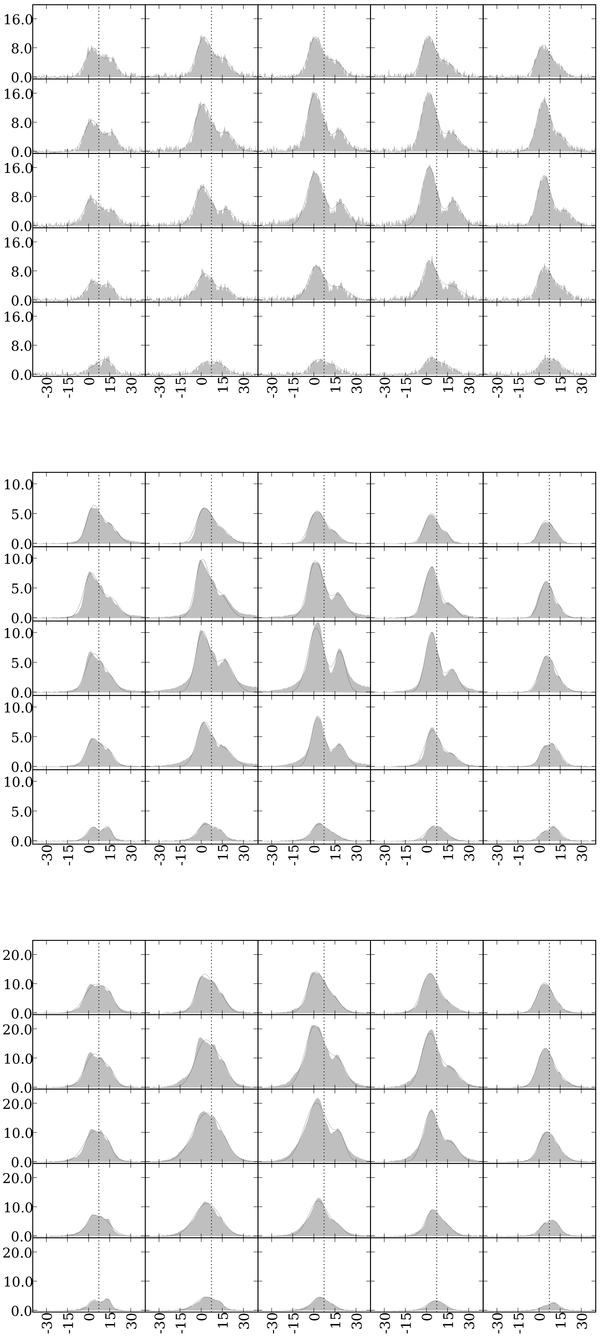
Observed spectral lines (shaded grey) and Gaussian fit profiles (black lines) towards a 37.5′′ × 37.5′′ grid centred at RA = 19:10:13.4; Dec: 09:06:14. The X-axis is velocity relative to the line rest frequency (km s-1); the Y-axis is Tmb (K). HCN J = 3−2 (top); HCN J = 4−3 (middle); HCO+ J = 4−3 (bottom). The dashed vertical line on each plot is at the expected source velocity of 7 km s-1.
Current usage metrics show cumulative count of Article Views (full-text article views including HTML views, PDF and ePub downloads, according to the available data) and Abstracts Views on Vision4Press platform.
Data correspond to usage on the plateform after 2015. The current usage metrics is available 48-96 hours after online publication and is updated daily on week days.
Initial download of the metrics may take a while.