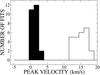
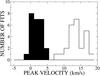
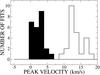
Fig. 6
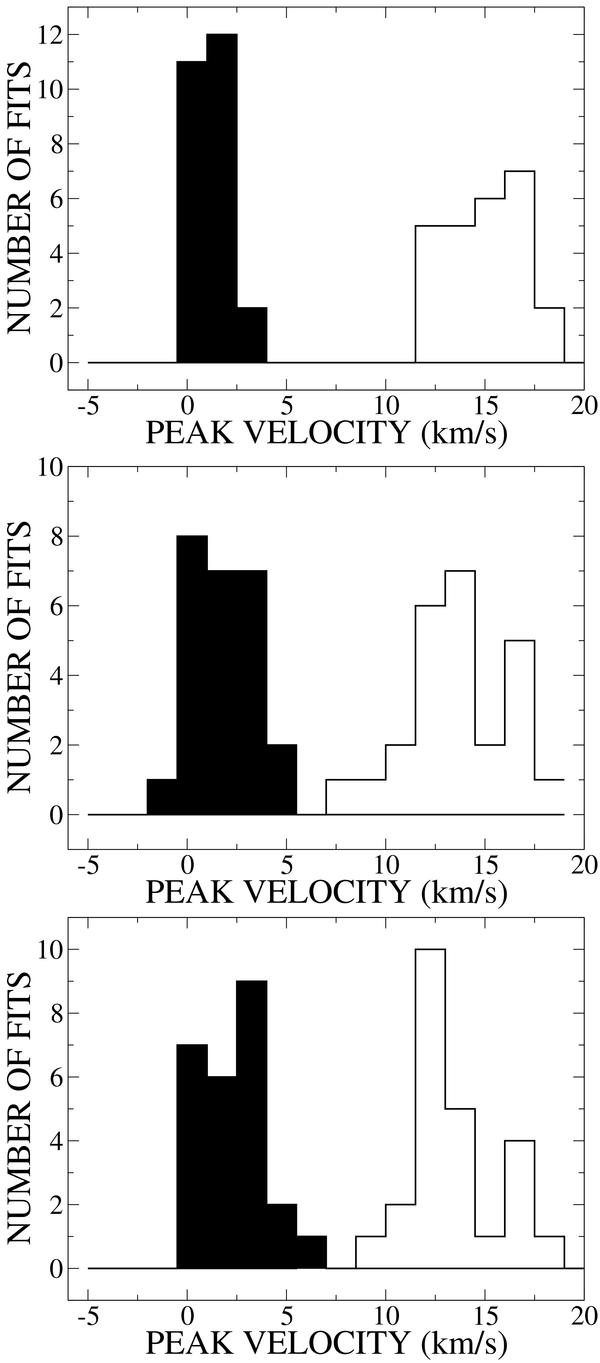
Histograms of the peak velocity for the spectral lines observed towards the centre of W49A (see Fig. 5)measured with double Gaussian fits to the line profiles at each map position. The number of lower velocity components is black and the number of higher velocity components is white. From top to bottom: HCN J = 3−2; HCN J = 4−3; HCO+ J = 4−3.
Current usage metrics show cumulative count of Article Views (full-text article views including HTML views, PDF and ePub downloads, according to the available data) and Abstracts Views on Vision4Press platform.
Data correspond to usage on the plateform after 2015. The current usage metrics is available 48-96 hours after online publication and is updated daily on week days.
Initial download of the metrics may take a while.