Fig. 11
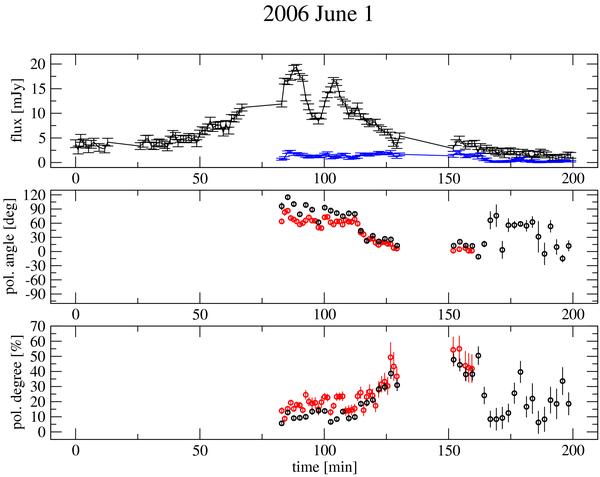
Total intensity (upper panel), polarization angle (middle panel), and polarization degree (lower panel) of Sgr A* as a function of time (2006 June 1). The black data points are the result of the new calibration method, the red points are obtained by the previously used “boot strapping” method as published in Zamaninasab et al. (2010). The blue points show polarized flux (p × I). The meridian transit occurred at 32.4 min, 50.4 min before the polarimetric measurements started.
Current usage metrics show cumulative count of Article Views (full-text article views including HTML views, PDF and ePub downloads, according to the available data) and Abstracts Views on Vision4Press platform.
Data correspond to usage on the plateform after 2015. The current usage metrics is available 48-96 hours after online publication and is updated daily on week days.
Initial download of the metrics may take a while.