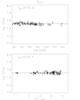
Fig. B.3
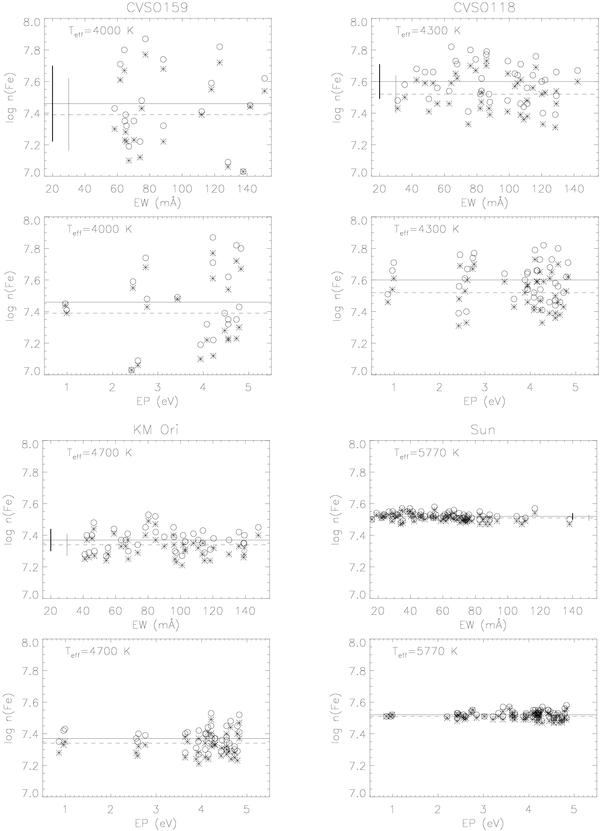
Comparison of iron abundances derived by using ATLAS and GAIA model atmospheres as a function of equivalent width (EW) and line excitation potential (EP). These examples display the results obtained for stars with four different temperatures. Circles and asterisks refer to abundances derived with ATLAS and GAIA models, respectively, while solid and dashed lines represent their mean values. Vertical thick and thin bars in the log n(Fe) vs. EW panels are the standard deviations around the average iron abundances.
Current usage metrics show cumulative count of Article Views (full-text article views including HTML views, PDF and ePub downloads, according to the available data) and Abstracts Views on Vision4Press platform.
Data correspond to usage on the plateform after 2015. The current usage metrics is available 48-96 hours after online publication and is updated daily on week days.
Initial download of the metrics may take a while.