Fig. 7
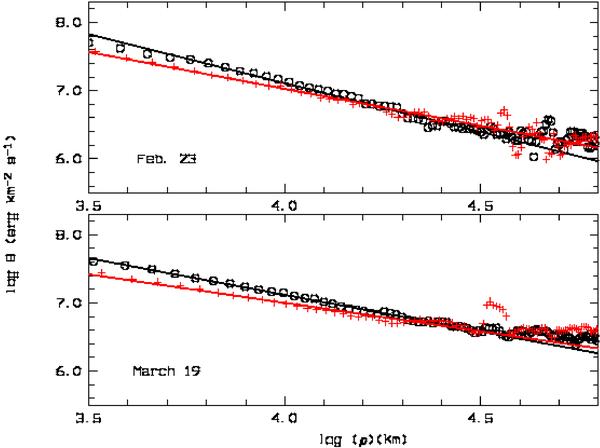
Dust brightness profiles, in log B − log ρ representation obtained from the spectroscopic measurements on Feb. 23 and March 19, 2009 in Sun (red crosses) – antisunward (black open circles) direction. The selected continuum region is 482−485 nm. Symbols refer to the observational data and solid line refers to the linear fit.
Current usage metrics show cumulative count of Article Views (full-text article views including HTML views, PDF and ePub downloads, according to the available data) and Abstracts Views on Vision4Press platform.
Data correspond to usage on the plateform after 2015. The current usage metrics is available 48-96 hours after online publication and is updated daily on week days.
Initial download of the metrics may take a while.