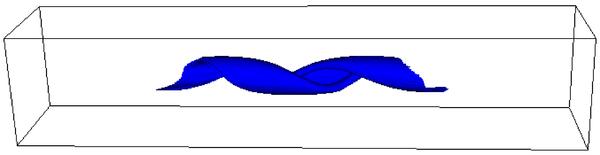
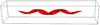
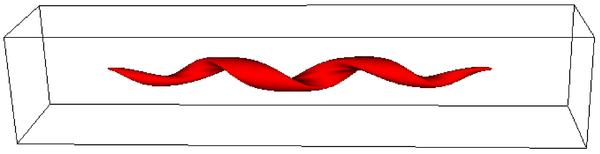
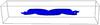
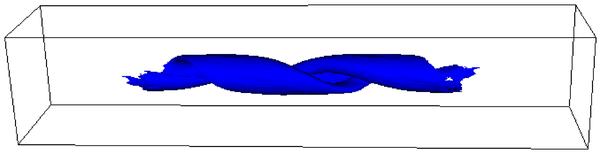
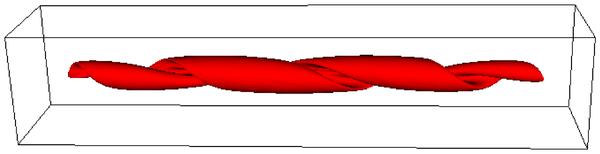
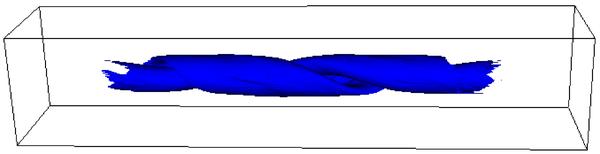
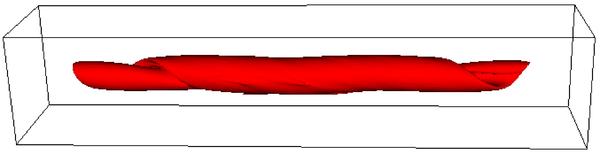
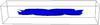
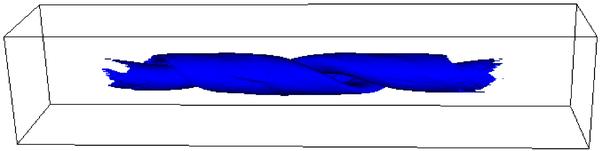
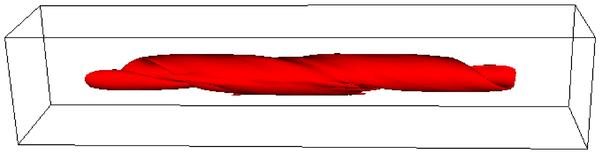
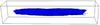
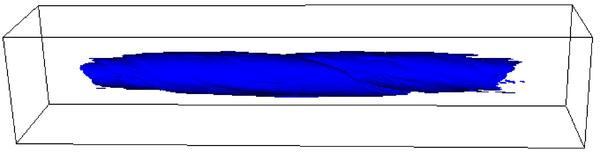
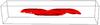
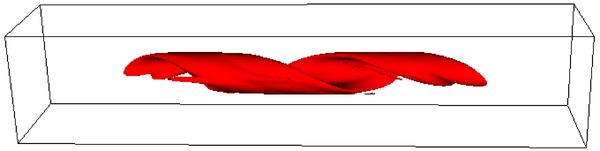
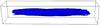
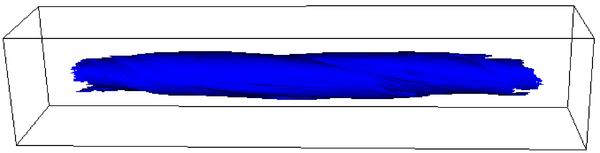
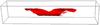
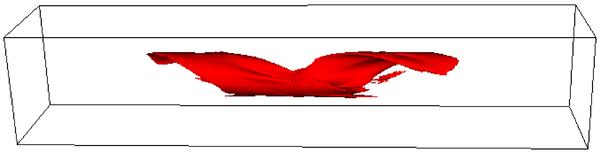
Fig. 8
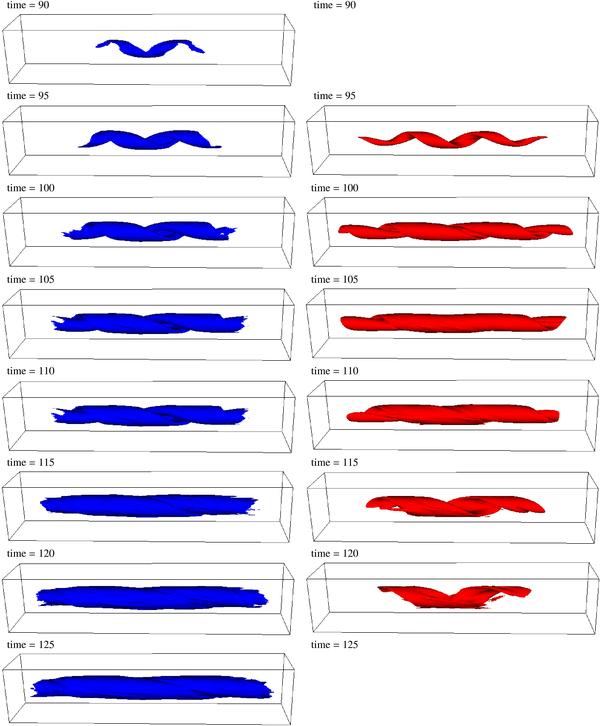
Isosurfaces of the normalised temperature T = 7.5 × 10⁻⁴, with the blue isosurfaces (left hand column) obtained without thermal conduction and the red isosurfaces (right hand column) with thermal conduction. At times 90 and 125 for the case with thermal conduction there is no plasma at this temperature and hence no isosurface is shown.
 time = 95
time = 95
time = 95
 time = 100
time = 100
time = 100

 time = 105
time = 105
time = 105


 time = 110
time = 110
time = 110

 time = 115
time = 115
time = 115
 time = 120
time = 120
time = 120
 time = 125
time = 125
time = 125
Current usage metrics show cumulative count of Article Views (full-text article views including HTML views, PDF and ePub downloads, according to the available data) and Abstracts Views on Vision4Press platform.
Data correspond to usage on the plateform after 2015. The current usage metrics is available 48-96 hours after online publication and is updated daily on week days.
Initial download of the metrics may take a while.