Free Access
Fig. 5
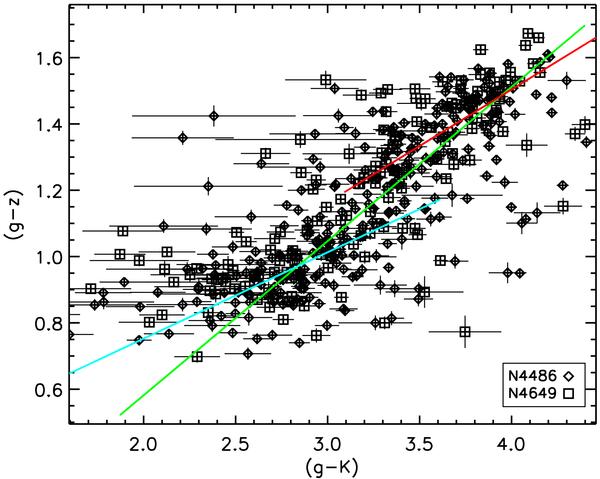
(g − K) vs. (g − z) for the joint GC systems of NGC 4486 and NGC 4649. The weighted best fit for the whole sample, given by Eq. (1) is over plotted in green. The best fit lines for the blue and red sub-populations, given by (2) and (3) are shown in blue and red respectively.
Current usage metrics show cumulative count of Article Views (full-text article views including HTML views, PDF and ePub downloads, according to the available data) and Abstracts Views on Vision4Press platform.
Data correspond to usage on the plateform after 2015. The current usage metrics is available 48-96 hours after online publication and is updated daily on week days.
Initial download of the metrics may take a while.