Fig. 3
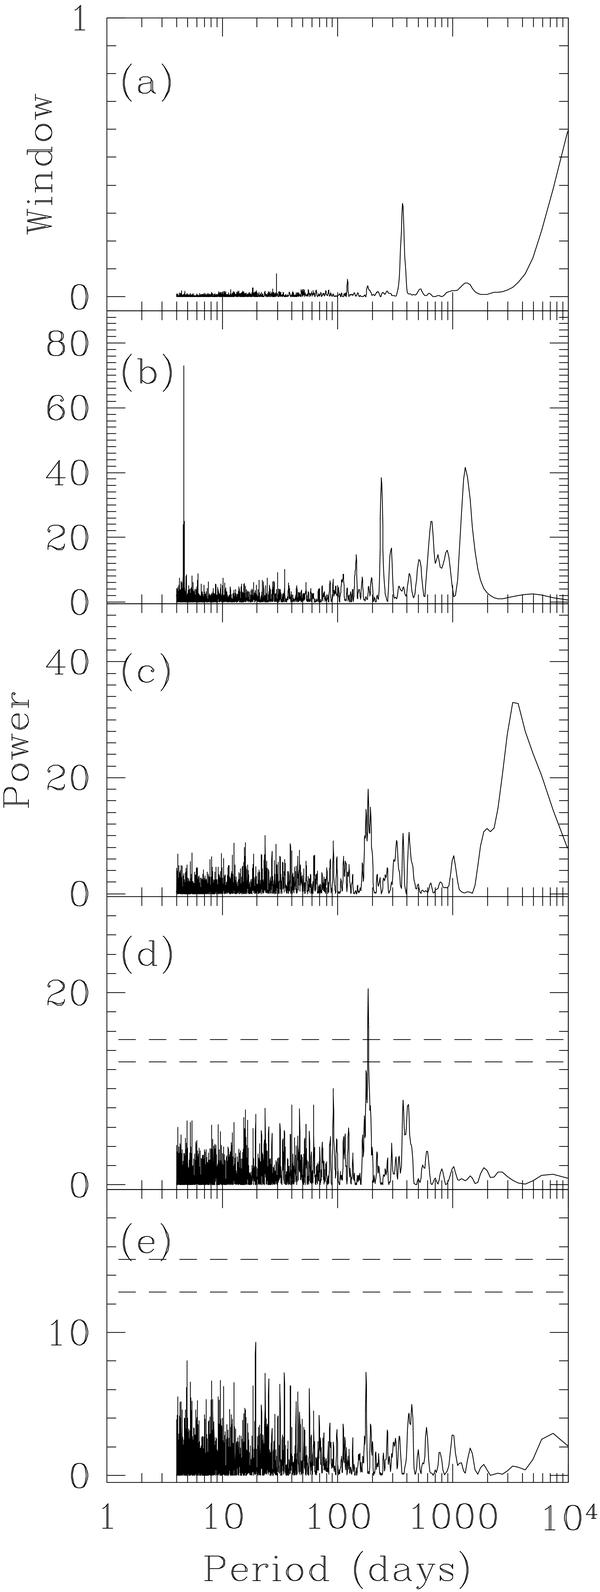
a) Window Function for the data taken with the Lick observatory. b) Periodogram of the data showing the periods of the 3 planets previously known (υ And−b, c and d). c) Periodogram of the residuals after subtracting planets b, c and d. This periodogram shows a strong peak at a period of about 3800 days, which corresponds to planet e (see main text). d) Periodogram of the residuals after subtracting 4 orbits. This periodogram shows a strong peak (with a FAP ~0.000005) at a period of about 183 days. e) Periodogram of the residuals after subtracting 5 orbits. This periodogram shows no significant peak. FAP thresholds of 1% and 0.1% are indicated as dashed lines.
Current usage metrics show cumulative count of Article Views (full-text article views including HTML views, PDF and ePub downloads, according to the available data) and Abstracts Views on Vision4Press platform.
Data correspond to usage on the plateform after 2015. The current usage metrics is available 48-96 hours after online publication and is updated daily on week days.
Initial download of the metrics may take a while.