Fig. 4
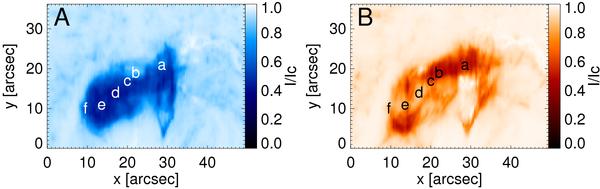
Intensity maps of the scanned active region obtained at different wavelength positions indicated by arrows in Fig. 2. Left A): At –30 km s-1 with respect to the central rest position of the Tr2,3 component of the He triplet. Right B): at +30 km s-1 with respect to the central rest position of the Tr2,3 component of the He triplet. The different letters refer to the line profiles shown in Fig. 5.
Current usage metrics show cumulative count of Article Views (full-text article views including HTML views, PDF and ePub downloads, according to the available data) and Abstracts Views on Vision4Press platform.
Data correspond to usage on the plateform after 2015. The current usage metrics is available 48-96 hours after online publication and is updated daily on week days.
Initial download of the metrics may take a while.