Fig. 8
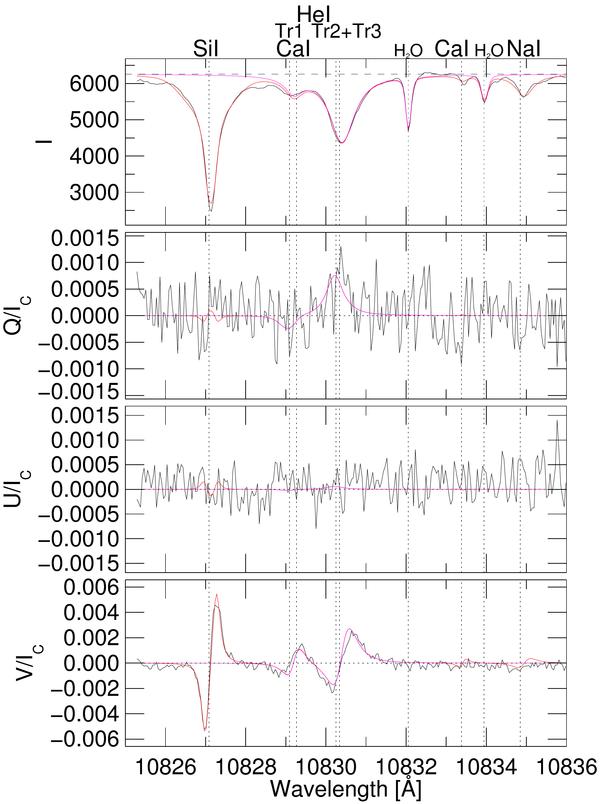
Observed spatially averaged and inverted Stokes I, Q, U and V profiles at the location (5′′, 13′′) of the map in Fig. 1. The solid black lines are the observed profiles, while the red lines are the fits to all observed lines obtained imposing one atmospheric component to describe the He I lines (magenta lines), and two for the photospheric lines.
Current usage metrics show cumulative count of Article Views (full-text article views including HTML views, PDF and ePub downloads, according to the available data) and Abstracts Views on Vision4Press platform.
Data correspond to usage on the plateform after 2015. The current usage metrics is available 48-96 hours after online publication and is updated daily on week days.
Initial download of the metrics may take a while.