Fig. 1
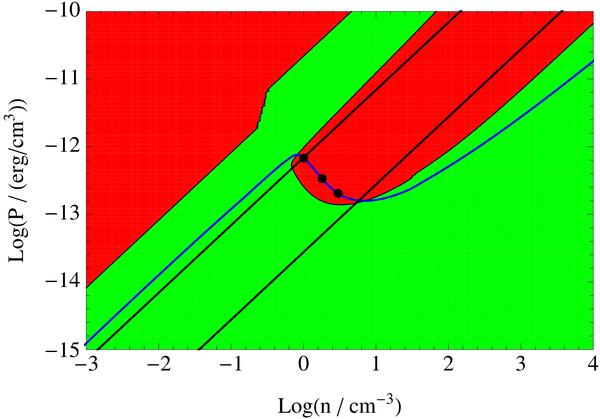
Pressure equilibrium curve for the used cooling and heating processes. Via the isobaric instability criterion (Hunter 1970) the regions of thermal instability (red) and thermal stability (green) are determined. In addition, the isothermal lines at  K and
K and  K are shown, which define our region of thermally unstable gas. The dots represent the starting points of the simulations, which all lay in the thermally unstable region.
Current usage metrics show cumulative count of Article Views (full-text article views including HTML views, PDF and ePub downloads, according to the available data) and Abstracts Views on Vision4Press platform.
Data correspond to usage on the plateform after 2015. The current usage metrics is available 48-96 hours after online publication and is updated daily on week days.
Initial download of the metrics may take a while.