Free Access
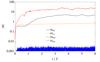
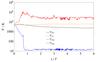
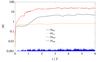
Fig. 2
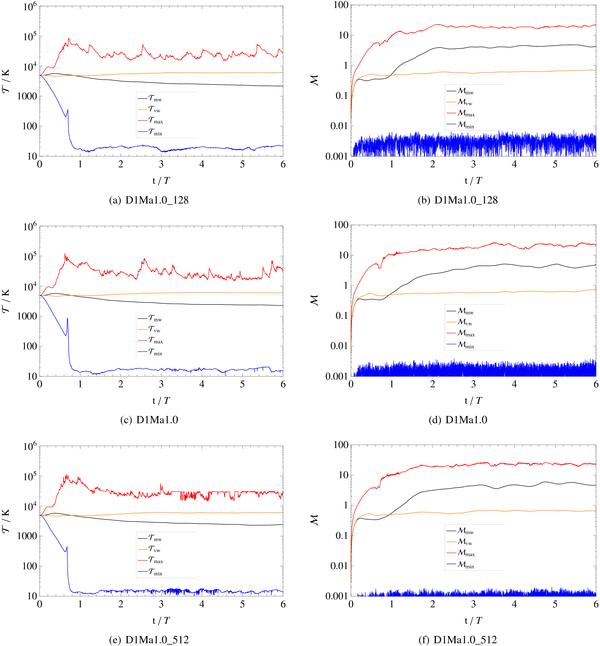
Time evolution of the temperature field (left panel) and the Mach number (right panel) for the simulation runs D1Ma1.0_128 (upper panel), D1Ma1.0 (mid panel), and D1Ma1.0_512 (lower panel). Plotted are the volume-weighted mean values, the mass-weighted mean values, and the maximum and minimum values.
This figure is made of several images, please see below:
Current usage metrics show cumulative count of Article Views (full-text article views including HTML views, PDF and ePub downloads, according to the available data) and Abstracts Views on Vision4Press platform.
Data correspond to usage on the plateform after 2015. The current usage metrics is available 48-96 hours after online publication and is updated daily on week days.
Initial download of the metrics may take a while.