Free Access
Fig. 6
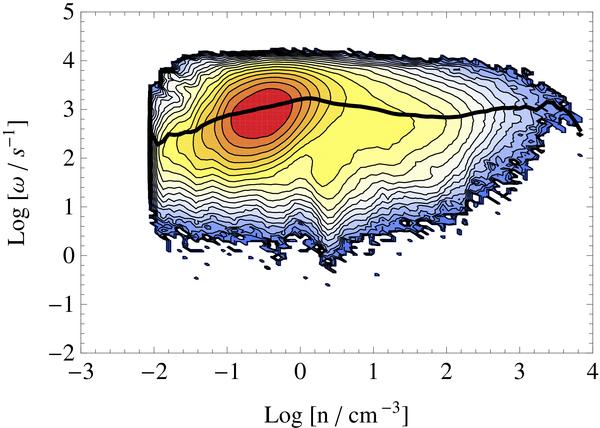
Two-dimensional PDF of the vorticity vs. the density for run D1Ma1.0_512 at t = 6.0 T with logarithmic scaled contour lines. The thick black line shows the density-dependent mean vorticity.
Current usage metrics show cumulative count of Article Views (full-text article views including HTML views, PDF and ePub downloads, according to the available data) and Abstracts Views on Vision4Press platform.
Data correspond to usage on the plateform after 2015. The current usage metrics is available 48-96 hours after online publication and is updated daily on week days.
Initial download of the metrics may take a while.