Fig. 4
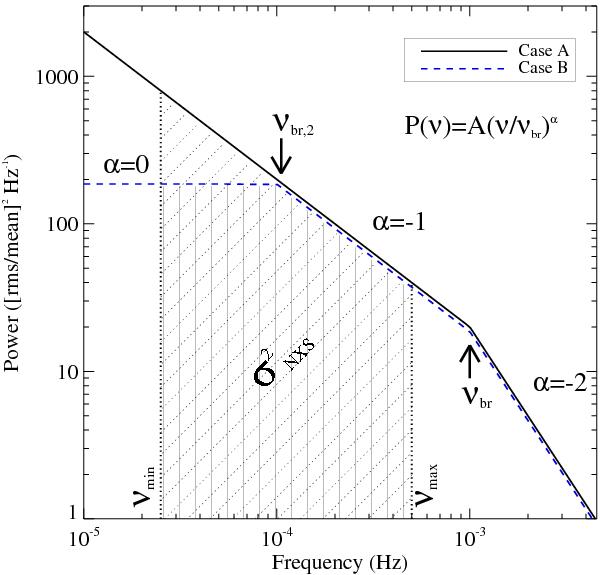
The assumed PSD shape in case A (continuous line) and case
B (dashed line) scenarios discussed in Sect. 4.5. νbr and
νbr,2 are the characteristic “frequency breaks”, at
which the PSD slope changes, while νmin and
νmax are the minimum and maximum frequencies sampled
by the light curve segments used in this work. We assume a second break frequency
which is 10 times smaller than νbr. The regions filled
with diagonal-dotted lines (vertical-continuous lines) indicate the area below the
PSD shape in case A (case B) scenario which should
be approximately equal to the excess variance of the light curves. This area (hence
 as
well) depends on the location of the break frequencies (determined by black hole
mass and accretion rate) with respect to νmax and
νmin (which are fixed according to the values
T and Δt of the light curves used in this
work).
as
well) depends on the location of the break frequencies (determined by black hole
mass and accretion rate) with respect to νmax and
νmin (which are fixed according to the values
T and Δt of the light curves used in this
work).
Current usage metrics show cumulative count of Article Views (full-text article views including HTML views, PDF and ePub downloads, according to the available data) and Abstracts Views on Vision4Press platform.
Data correspond to usage on the plateform after 2015. The current usage metrics is available 48-96 hours after online publication and is updated daily on week days.
Initial download of the metrics may take a while.